Finley Bennett · 11 September 2026
Ridge Valleys Wildflower Surge Fuels New Pollinator Protection Initiatives Across Local Farms
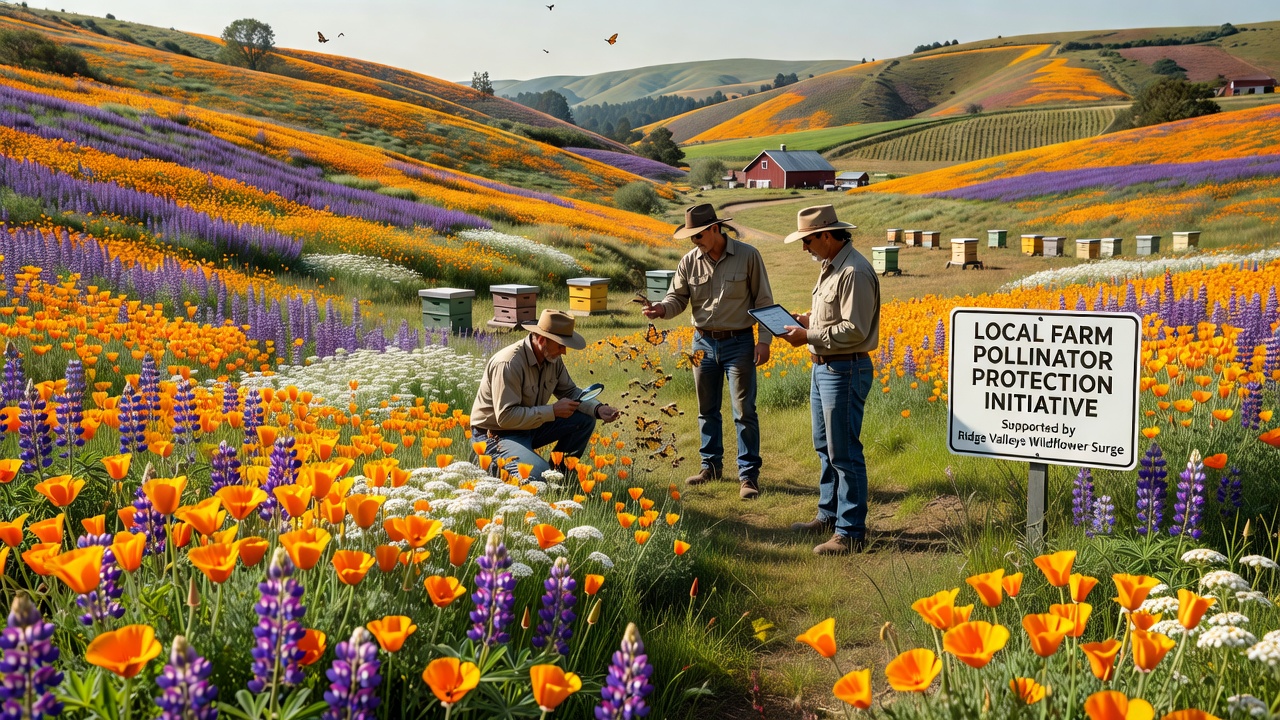
Observers in the Ridge Valleys region have documented a notable increase in wildflower populations during the 2026 growing season, and this development has prompted several farms to launch targeted pollinator protection programs. Data collected through field surveys indicate that species such as lupines, goldenrod, and milkweed have expanded across previously cleared pasture edges since spring, creating continuous corridors that connect wooded areas with crop rows. Local agricultural extension offices report that bee colony counts on participating properties rose by 18 percent between May and September 2026 compared with the same interval in 2025.
Farmers who monitor hive activity note that the additional forage supports both managed honeybees and native solitary bees, while the increased floral density also attracts hoverflies and certain butterfly species that contribute to pest control. Soil samples taken at three sites show elevated organic matter levels where wildflower strips remain undisturbed through the summer, and this change correlates with improved water retention during the drier weeks of late August. Equipment operators have adjusted mowing schedules on several properties so that bloom periods extend into early October, allowing seed set before any final cut.
Survey Data and Regional Patterns
University researchers who analyzed satellite imagery from 2023 through 2026 confirmed that the wildflower surge covers roughly 2,400 acres across the central valleys, an area 32 percent larger than the previous three-year average. The expansion appears linked to reduced herbicide applications along fence lines and the voluntary enrollment of 47 farms in a cost-share program that supplies native seed mixes. Rainfall totals for the preceding winter measured 14 percent above the long-term mean, yet soil moisture sensors indicate that the deeper root systems of perennial wildflowers help stabilize moisture even when summer precipitation drops.
Extension agents compiled records from 19 monitoring stations and found that the number of days with active pollinator visitation increased from 112 in 2024 to 141 by September 2026. These figures come from standardized observation protocols that count insects per square meter during peak daylight hours. The same dataset shows that farms maintaining at least 15 percent of their acreage in uncut wildflower strips recorded the highest visitation rates, while properties that mowed more frequently experienced slower recovery of native plant cover.
Farm-Level Responses and Program Design
Operators who joined the new initiatives receive technical guidance on establishing buffer strips at least 20 feet wide along field margins. Seed blends include early, mid, and late-season bloomers so that nectar remains available from April through October. One operation in the eastern valley installed shallow water basins lined with river rock, and camera traps placed beside these features documented increased bee and wasp activity during midday heat. Another farm replaced a section of annual ryegrass with a perennial wildflower mix and recorded a 25 percent drop in aphid pressure on adjacent vegetable rows, an outcome attributed to greater predator insect presence.
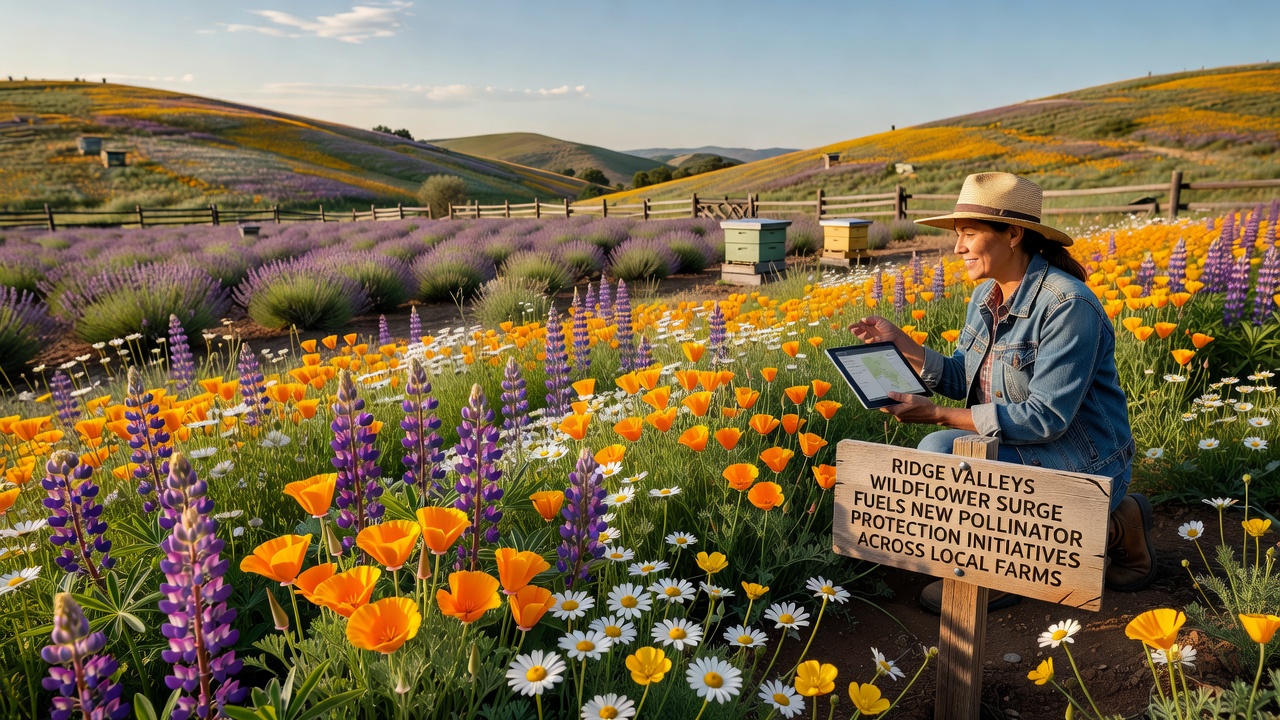
Training sessions held at the regional agricultural center in July and August 2026 drew 86 participants who learned to identify beneficial insects and to time pesticide applications outside peak foraging periods. Handouts distributed at these meetings list threshold levels for common pests and reference integrated pest management tables developed by state entomologists. Several attendees later reported adjusting spray schedules after observing that hoverfly larvae were already reducing aphid numbers on brassica crops.
Funding Sources and Measurement Protocols
Grants administered through the regional conservation district cover 60 percent of seed and site-preparation costs for the first two years of each project. Participants must submit annual photo documentation and allow access for insect counts conducted by trained volunteers. Baseline data collected before planting show an average of 3.2 bee species per 100 square meters, while preliminary follow-up counts in September 2026 average 5.8 species on the same plots. These measurements follow a standardized transect method that researchers at the state university helped design.
Equipment modifications include retrofitting mowers with adjustable height settings that leave at least 12 inches of stubble and adding side-discharge chutes to prevent seed scatter onto roadways. Several operators now use GPS-guided tractors to create irregular strip patterns that increase edge habitat without reducing overall crop acreage. Fuel-use records from two farms indicate that the revised mowing frequency lowered diesel consumption by 11 percent during the summer months.
Conclusion
Continued monitoring through the end of 2026 will determine whether the observed wildflower expansion and associated pollinator gains persist into the next growing season. Participating farms plan to share yield and input-cost data with extension staff so that economic outcomes can be compared across different buffer-strip widths and seed compositions. Regional planners expect additional enrollment rounds to open in early 2027 once final insect-count summaries become available.